Classify every trace by intent
Each new trace is matched to its closest intent in real time, so the picture stays current as traffic grows.
Classify every trace by intent: Docs (opens in new tab)Agent Insights
Trusted by teams shipping agents in production
What is Agent Insights?
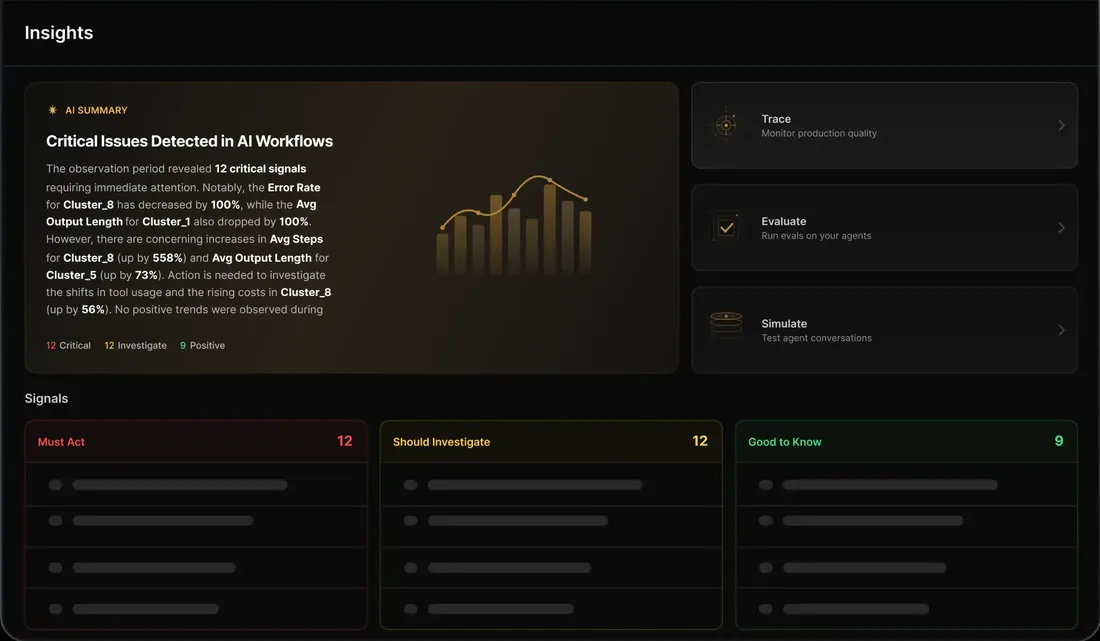
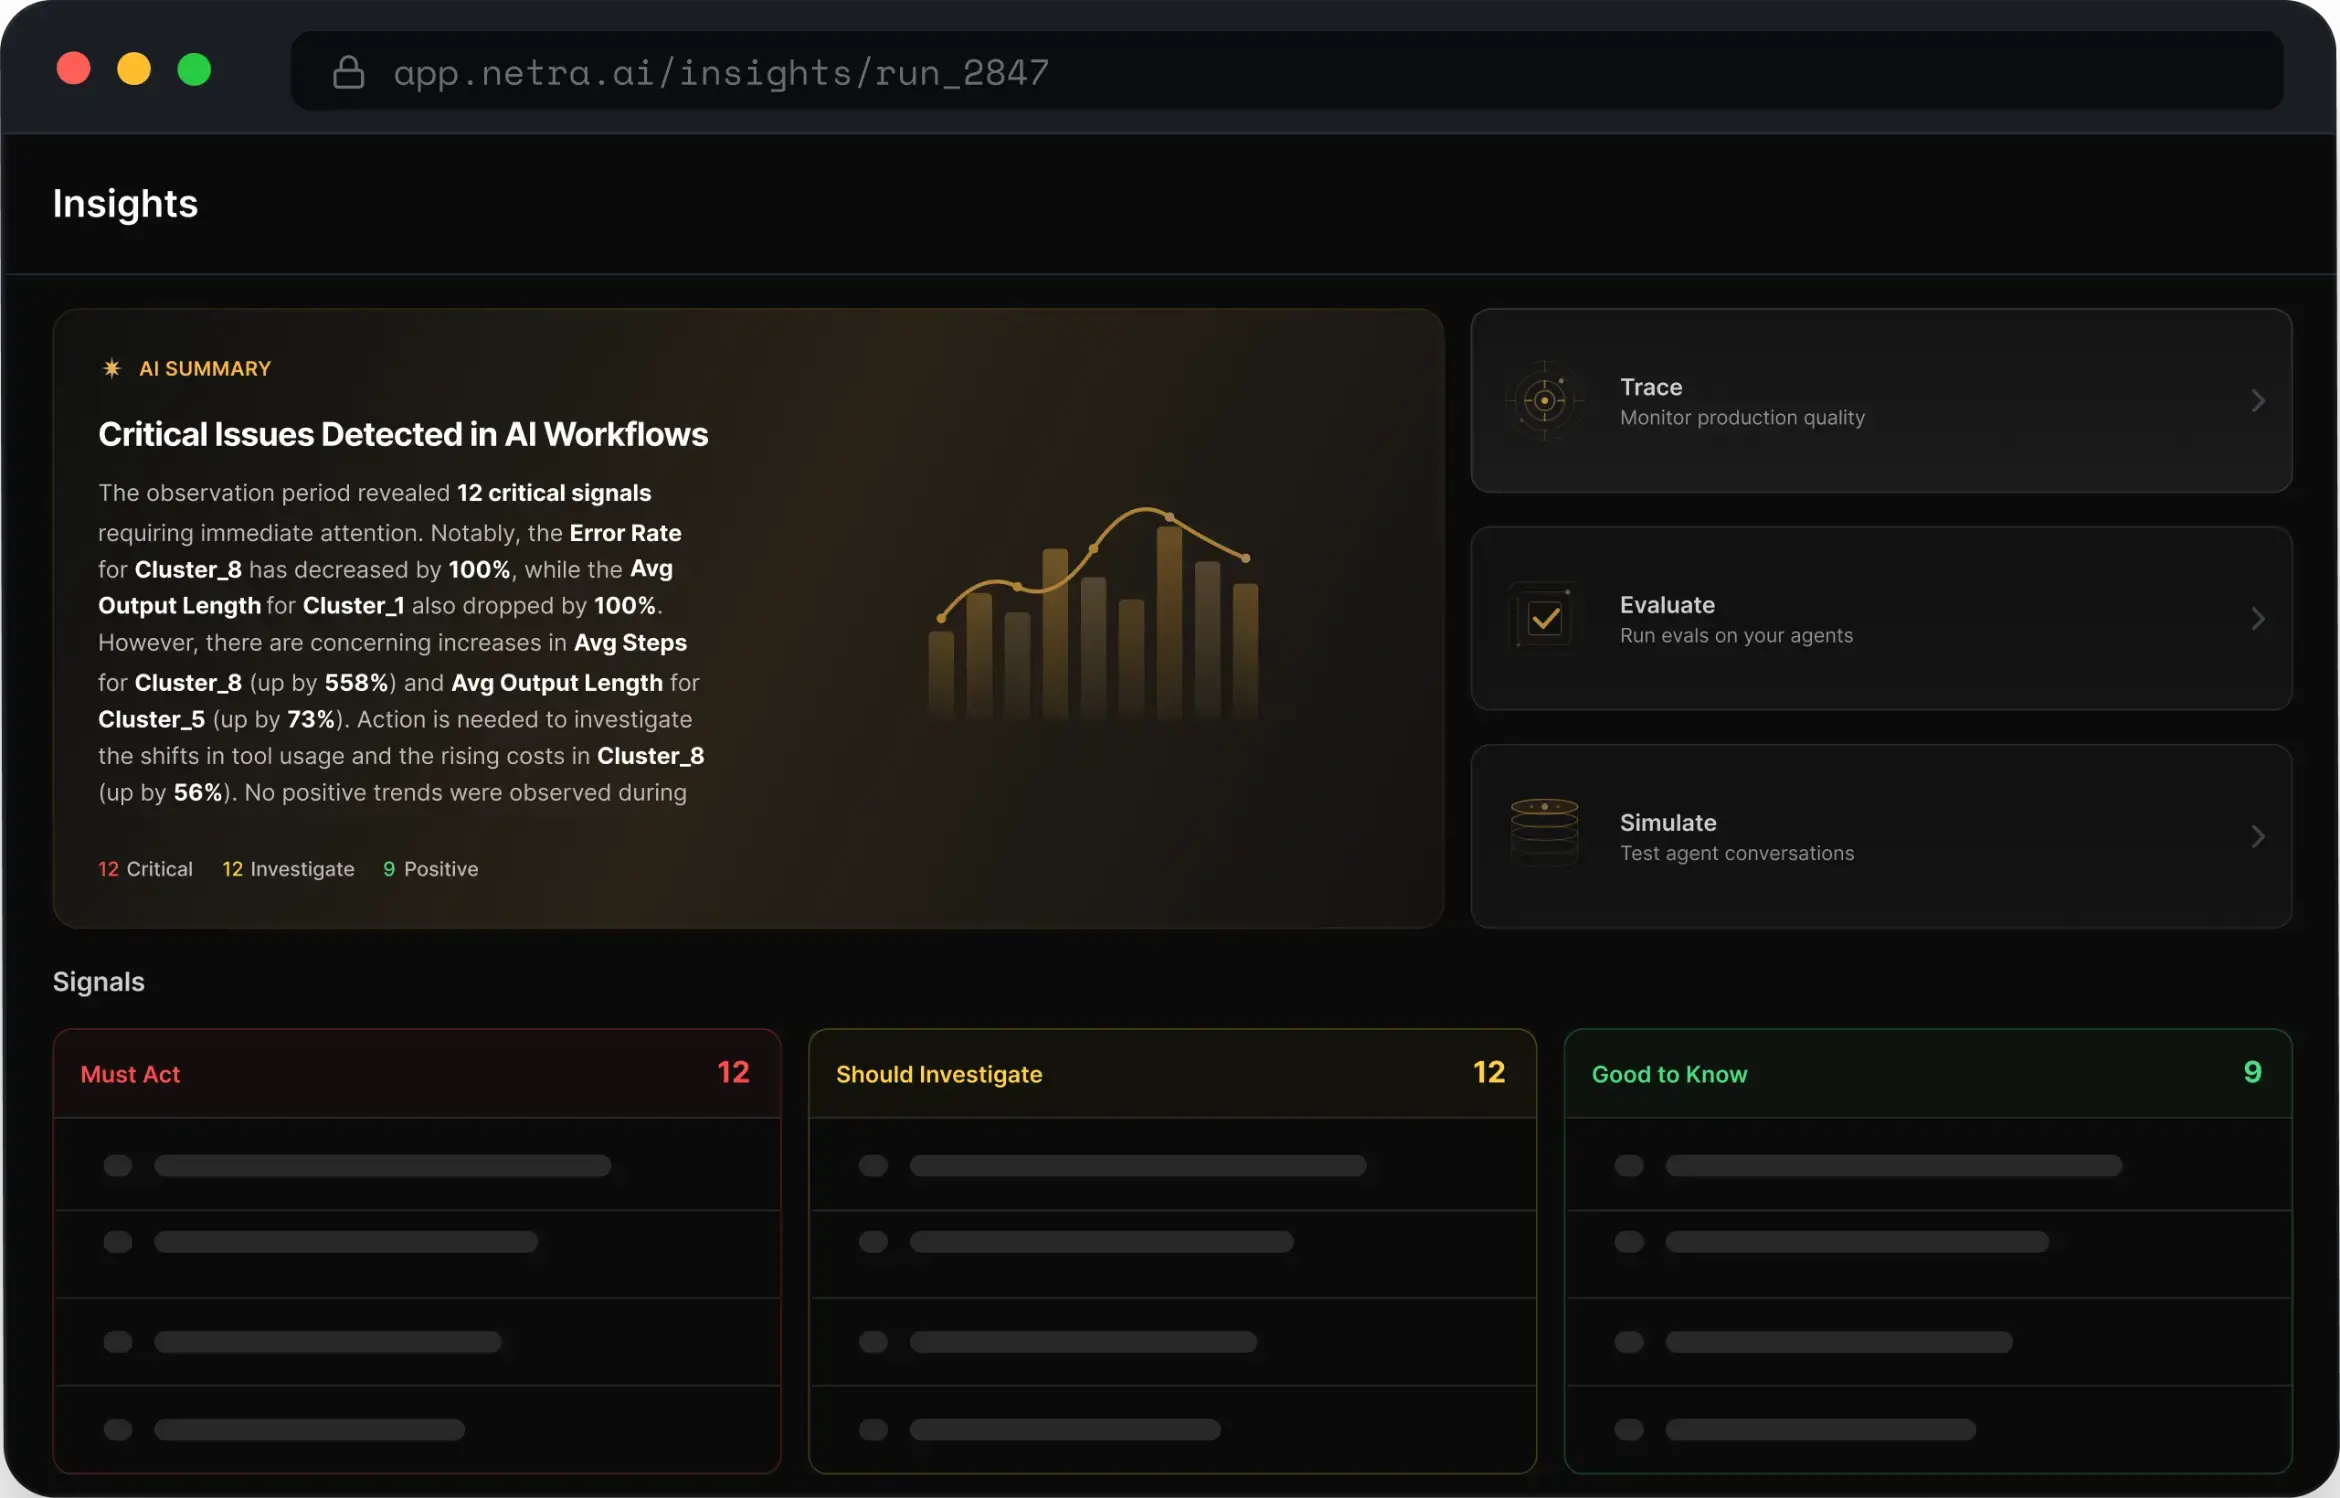
A daily read on how your agent is really behaving. Insights clusters your production traces into intents, classifies every new trace, and compares cost, latency, errors and tool use against a rolling baseline. What moved is summarised in a brief, ranked by urgency, and there is nothing to configure.
After about 500 traces, your traffic is clustered into labelled intents and every new trace is classified. You see workflows instead of averages.
Each new trace is matched to its closest intent in real time, so the picture stays current as traffic grows.
Classify every trace by intent: Docs (opens in new tab)Traces that match no known intent are surfaced daily, often the first sign users want something new.
Spot new intents early: Docs (opens in new tab)Cost, latency, step count, error rate, output length and tool use for one intent.
Open a detailed intent view: Docs (opens in new tab)A status label from the last 30 days shows which workflows are growing and which are fading.
Follow each intent's volume trend: Docs (opens in new tab)Cost, latency, step count, error rate, output length and tool use are tracked per intent, so a slowdown in one workflow can't hide behind the rest.
Behavioural, output and input drift, scored with calibrated statistics. No thresholds to tune.
Detect drift automatically: Docs (opens in new tab)Changes in which tools an intent calls, measured with Jensen–Shannon divergence. It is the quiet change behind many regressions.
Notice shifts in tool usage: Docs (opens in new tab)Each signal names the metric, the window, the intent it affects and how far it moved.
Read detailed signals: Docs (opens in new tab)Every metric is measured against the previous 30 days, refreshed daily.
Compare against a rolling baseline: Docs (opens in new tab)After each observation window, a short digest of the most significant drifts and new intents, ranked so the team starts with what needs action today.
The drifts and new intents from the latest cycle, in the order they matter.
Start with a daily overview: Docs (opens in new tab)Every finding is ranked by urgency, so the team acts on the first and skims the last.
Sort into must act, should investigate, good to know: Docs (opens in new tab)The intent, the metrics that moved and the traces that show it, in one place.
Open a detailed insight view: Docs (opens in new tab)Daily, weekly and monthly windows, so a slow slide shows up as clearly as a spike.
See trends across multiple timelines: Docs (opens in new tab)Take an insight into your IDE with the traces behind it, and put an alert on the patterns you never want to miss again.
Pull the traces and sessions behind an insight into Cursor, Claude Code or Windsurf through the Netra MCP server.
Debug using MCP: Docs (opens in new tab)Add the failing traces to a dataset, so the fix is checked on every release.
Turn findings into test cases: Docs (opens in new tab)Layer alert rules over insight metrics when a drift should notify someone, not just appear in the brief.
Set alert rules on top: Docs (opens in new tab)Each new brief shows whether the drift settled and the intent's metrics moved back.
Check that the fix worked: Docs (opens in new tab)Nothing to set up beyond the SDK you already use. Insights starts working as traces arrive, with defaults calibrated for every metric.
Baselines, windows and severity levels are calibrated for you, with no rules to write.
Docs (opens in new tab)A rolling 30-day baseline, refreshed daily, keeps comparisons fair as your agent changes.
Docs (opens in new tab)In production


For security workflows, explainability isn't optional. Netra let us show exactly how our agents investigate — every decision, tool call, and LLM exchange, giving CISOs the confidence they need.
Can't find the answer here? The Agent Insights docs go deeper, or talk to our team.
Nothing beyond traces flowing through the Netra SDK. Intents, baselines and drift detection all run automatically with calibrated defaults.
About 500 traces. After that, Insights clusters your traffic into labelled intents and classifies every new trace against them.
Behavioural drift in cost per trace, latency and step count; output drift in error rate and output length; tool-usage drift in which tools are called; and input drift when user requests stop matching known intents.
Daily, weekly and monthly — each compared against a rolling baseline, with the 30-day baseline refreshed daily.
Most metrics are scored with Z-scores; error rate and output length use percentage change; tool distribution uses Jensen–Shannon divergence. Severity is calibrated for you rather than set by hand.
Yes. Each observation cycle produces a brief of the most significant drifts and new intents, and you can add alert rules on top of the metrics.
Start today
Send traces, and let Netra tell you what your users are doing and what changed this week. Free to start.