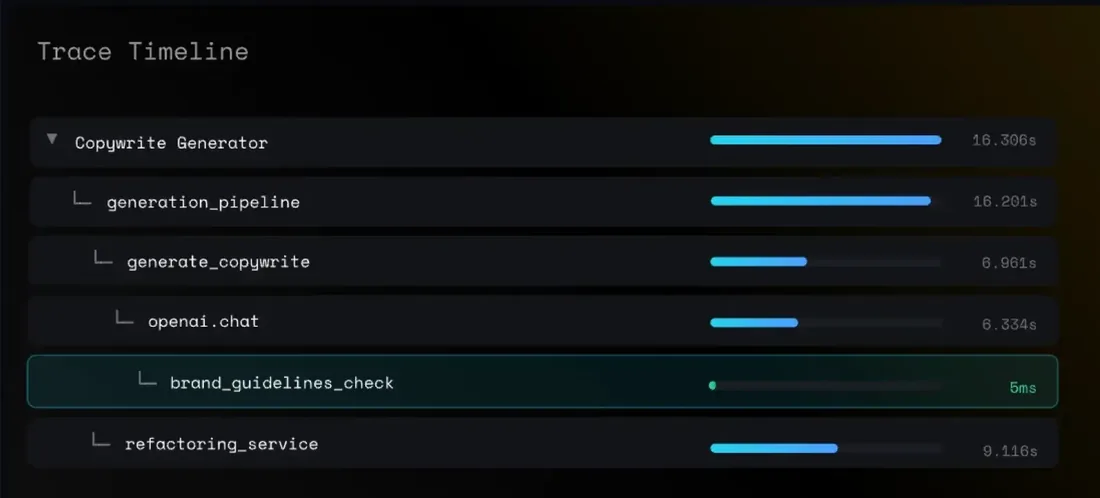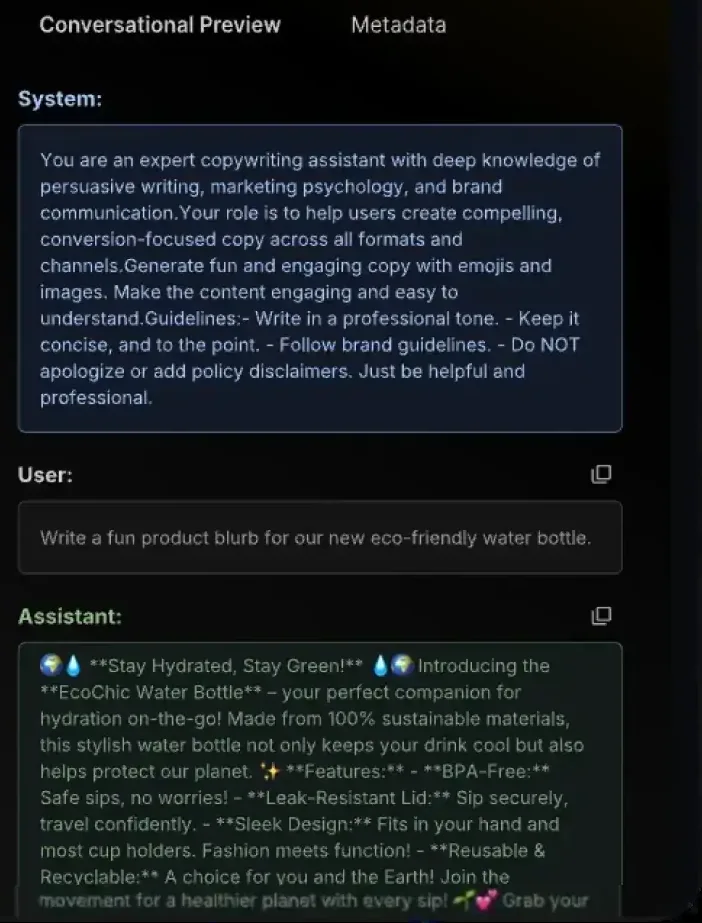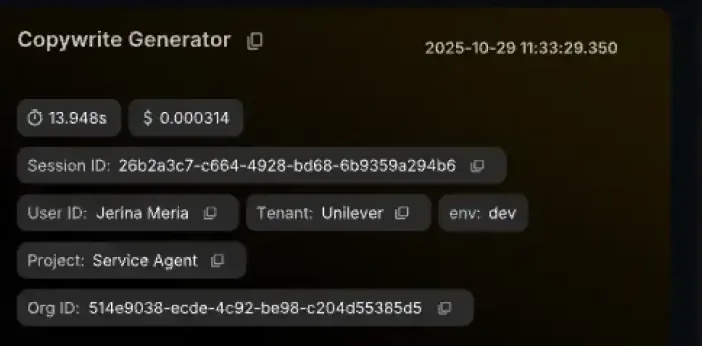
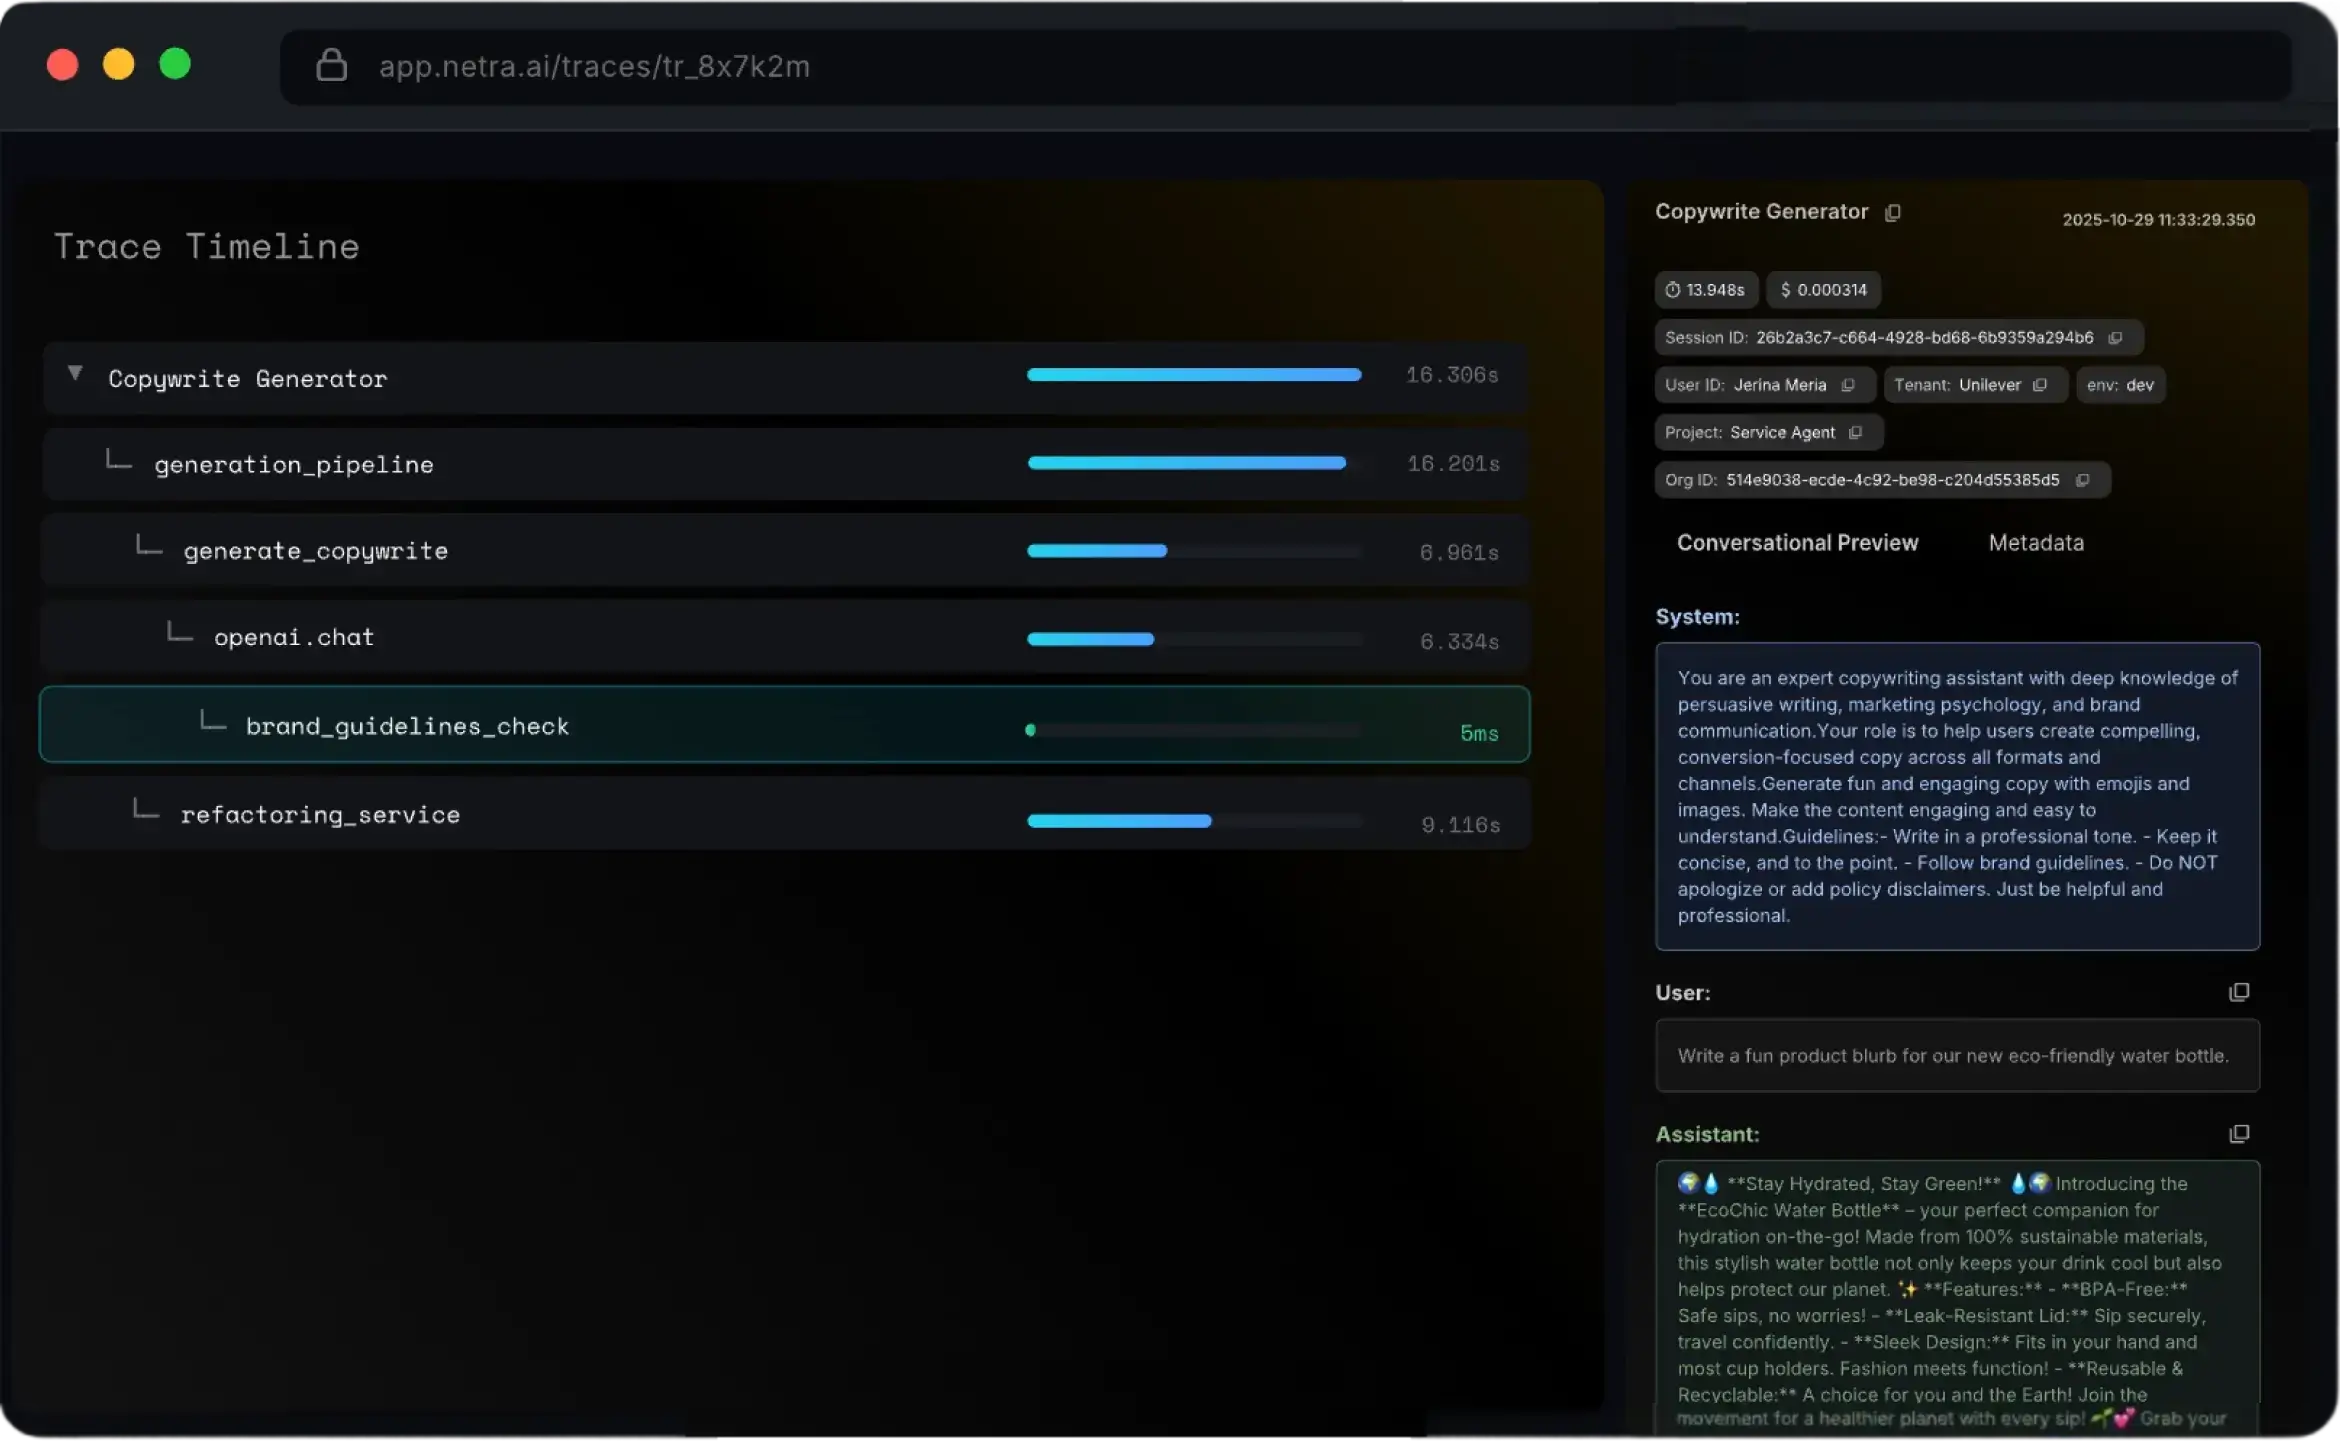
See detailed traces and spans, tool calls included
Every LLM call, tool call, retrieval and database query, nested parent to child on a timing waterfall.
See detailed traces and spans, tool calls included: Docs (opens in new tab)Observability
Trusted by teams shipping agents in production
What is Observability?
A structured record of every step your agent takes. Netra captures each LLM call, tool call and retrieval as a span inside a trace, with inputs, outputs, latency, tokens and cost. Sessions, users and tenants group those traces, so you can go from a customer's complaint to the exact step that caused it.
Every LLM call, tool call and retrieval is its own span on a timeline, with inputs, outputs, latency and tokens. A bad answer points at the step that caused it.
Every LLM call, tool call, retrieval and database query, nested parent to child on a timing waterfall.
See detailed traces and spans, tool calls included: Docs (opens in new tab)Inputs, outputs, parameters and type-specific details such as model names and token counts, one click into any span.
See the metadata of every step: Docs (opens in new tab)Spot the slow or expensive step, then roll the numbers up by model, tenant, user or time range.
See cost, latency and tokens on every span: Docs (opens in new tab)Span, generation, embedding, tool and agent types are assigned automatically, so each step shows up as what it is.
Tell every step apart by type: Docs (opens in new tab)Set a tenant ID once in middleware and every trace, token and dollar after it is attributed to that customer. The same views work for every agent, session and user.
Agent cost, latency and tool use; tenant spend; sessions as whole conversations; every trace for one user.
Switch between agent, tenant, session and user views: Docs (opens in new tab)Sessions, traces and total cost for every customer, sorted by spend, so the heaviest users are one glance away.
Attribute cost and usage to each tenant: Docs (opens in new tab)Group multi-turn interactions by session and user, then drill from session totals to the exact span.
Debug the journey, not 40 requests: Docs (opens in new tab)Search by name, time range, status or any custom attribute, choose your columns, and save the filter.
Save the views your team checks: Docs (opens in new tab)Latency percentiles, error rates, cost and tokens across all of your traffic, out of the box. Then build the dashboards your team will actually open.
Latency percentiles, error rate, request volume, cost, tokens and time to first token across every agent.
See detailed analytics of your traces: Docs (opens in new tab)Six chart types over the same metrics, segmented by environment, user, session or tenant.
Build custom dashboards: Docs (opens in new tab)Narrow by model, user, session, error or PII flags, and by latency or cost range.
Filter down to what matters: Docs (opens in new tab)Add a widget to as many dashboards as you like, or clone a whole one, so every team reports on the same numbers.
Reuse widgets across dashboards: Docs (opens in new tab)Pull the failing trace into your IDE through MCP, then turn it into a test case. The same bug can't ship twice.
Bring traces, spans and sessions into Cursor, Claude Code, Windsurf or Codex through the Netra MCP server.
Debug using MCP: Docs (opens in new tab)Fetch spans by trace ID, filter traces with pagination, and inspect session metrics without leaving your editor.
Look up any trace or session: Docs (opens in new tab)Turn a failing production trace into a test case, so the bug you just found becomes a check in your next evaluation.
Add a trace as a test case: Docs (opens in new tab)Create a dataset and add items one at a time or in bulk, straight from your coding agent.
Grow a dataset from your editor: Docs (opens in new tab)Built on OpenTelemetry with custom exporters, so Netra adds agent-level context without asking you to rip out what already works.
One Netra.init() traces 30+ AI libraries, including model providers, frameworks and vector databases, with no code changes.
@workflow, @agent, @task and @span for minimal-code tracing, plus manual spans for anything custom.
Speech-to-text, the reasoning LLM and text-to-speech land in one trace, so a delay shows up on the stage that caused it.
Docs (opens in new tab)Choose which libraries are instrumented, and switch off prompt and response capture while keeping latency, token and cost metrics.
Docs (opens in new tab)In production


Netra turned our ad-agent stack from a black box into a clear control center. We can see what every agent is doing, for every tenant, in real time, and Netra now processes over 1M spans every day for Pencil. Issues that once took hours to debug now take minutes.
Can't find the answer here? The Observability docs go deeper, or talk to our team.
The complete execution of a request: LLM calls with prompts, completions and model parameters, tool invocations, retrieval steps, token usage, latency per step, cost, errors and any custom metadata you attach.
A trace is the whole journey of one request. Spans are the individual operations inside it — each LLM call, tool call or retrieval — arranged parent-to-child.
Three, and they mix: auto-instrumentation with no code changes, decorators such as @workflow, @agent and @task, and manual spans for full control.
Use the @agent decorator for agent execution, set_session_id to group related interactions, and set_user_id to attribute traces to a person. set_tenant_id does the same for a customer.
Token usage and cost are captured automatically for supported providers and can be broken down by model, tenant, user or time range. For a custom gateway or unsupported provider, attach usage as span attributes.
Yes. Content capture can be switched off while latency, token and cost metrics are kept, and you choose exactly which libraries are instrumented.
Start today
Install the SDK and see your first trace in minutes. Free to start.